from examples.example_2_branching_multistep.ex_2_model_classes import Trial, g
import pandas as pd
import os

#| echo: true

g.sim_duration = 3000
g.number_of_runs = 1Vidigi vs BupaR
The title of this section is perhaps misleading! As the author of the package, I think the visuals produced by the two packages occupy slightly different niches, and the use of both can benefit your project.
As an additional bonus, the process of creating the logs you require for a vidigi project give you the perfect dataset for your bupaR visuals too!
bupaR outputs could form part of a verification and validation strategy. They can also perform part of your communications strategy, helping to provide a talking point for meetings with stakeholders in much the same way as a screenshot of your Simul8 or Anylogic model would. In the absence of a graphical interface for building a model, the bupar outputs can help you - and your stakeholders - to ensure that linkages between different model steps are sensible and appropriate.
The Python Preprocesing
We will begin in Python, working to add a couple of columns to our vidigi event log to prepare it for use in bupaR.
View Imported Code, which has had logging steps added at the appropriate points in the ‘model’ class
import random
import numpy as np
import pandas as pd
import simpy
from sim_tools.distributions import Exponential, Lognormal, Uniform, Normal, Bernoulli
from vidigi.resources import populate_store
from examples.simulation_utility_functions import trace
# Class to store global parameter values. We don't create an instance of this
# class - we just refer to the class blueprint itself to access the numbers
# inside.
class g:
'''
Create a scenario to parameterise the simulation model
Parameters:
-----------
random_number_set: int, optional (default=DEFAULT_RNG_SET)
Set to control the initial seeds of each stream of pseudo
random numbers used in the model.
n_triage: int
The number of triage cubicles
n_reg: int
The number of registration clerks
n_exam: int
The number of examination rooms
n_trauma: int
The number of trauma bays for stablisation
n_cubicles_non_trauma_treat: int
The number of non-trauma treatment cubicles
n_cubicles_trauma_treat: int
The number of trauma treatment cubicles
triage_mean: float
Mean duration of the triage distribution (Exponential)
reg_mean: float
Mean duration of the registration distribution (Lognormal)
reg_var: float
Variance of the registration distribution (Lognormal)
exam_mean: float
Mean of the examination distribution (Normal)
exam_var: float
Variance of the examination distribution (Normal)
trauma_mean: float
Mean of the trauma stabilisation distribution (Exponential)
trauma_treat_mean: float
Mean of the trauma cubicle treatment distribution (Lognormal)
trauma_treat_var: float
Variance of the trauma cubicle treatment distribution (Lognormal)
non_trauma_treat_mean: float
Mean of the non trauma treatment distribution
non_trauma_treat_var: float
Variance of the non trauma treatment distribution
non_trauma_treat_p: float
Probability non trauma patient requires treatment
prob_trauma: float
probability that a new arrival is a trauma patient.
'''
random_number_set = 42
n_triage=2
n_reg=2
n_exam=3
n_trauma=4
n_cubicles_non_trauma_treat=4
n_cubicles_trauma_treat=5
triage_mean=6
reg_mean=8
reg_var=2
exam_mean=16
exam_var=3
trauma_mean=90
trauma_treat_mean=30
trauma_treat_var=4
non_trauma_treat_mean=13.3
non_trauma_treat_var=2
non_trauma_treat_p=0.6
prob_trauma=0.12
arrival_df="ed_arrivals.csv"
sim_duration = 600
number_of_runs = 100
# Class representing patients coming in to the clinic.
class Patient:
'''
Class defining details for a patient entity
'''
def __init__(self, p_id):
'''
Constructor method
Params:
-----
identifier: int
a numeric identifier for the patient.
'''
self.identifier = p_id
# Time of arrival in model/at centre
self.arrival = -np.inf
# Total time in pathway
self.total_time = -np.inf
# Shared waits
self.wait_triage = -np.inf
self.wait_reg = -np.inf
self.wait_treat = -np.inf
# Non-trauma pathway - examination wait
self.wait_exam = -np.inf
# Trauma pathway - stabilisation wait
self.wait_trauma = -np.inf
# Shared durations
self.triage_duration = -np.inf
self.reg_duration = -np.inf
self.treat_duration = -np.inf
# Non-trauma pathway - examination duration
self.exam_duration = -np.inf
# Trauma pathway - stabilisation duration
self.trauma_duration = -np.inf
# Class representing our model of the clinic.
class Model:
'''
Simulates the simplest minor treatment process for a patient
1. Arrive
2. Examined/treated by nurse when one available
3. Discharged
'''
# Constructor to set up the model for a run. We pass in a run number when
# we create a new model.
def __init__(self, run_number):
# Create a SimPy environment in which everything will live
self.env = simpy.Environment()
self.event_log = []
# Create a patient counter (which we'll use as a patient ID)
self.patient_counter = 0
self.trauma_patients = []
self.non_trauma_patients = []
# Create our resources
self.init_resources()
# Store the passed in run number
self.run_number = run_number
# Create a new Pandas DataFrame that will store some results against
# the patient ID (which we'll use as the index).
self.results_df = pd.DataFrame()
self.results_df["Patient ID"] = [1]
self.results_df["Queue Time Cubicle"] = [0.0]
self.results_df["Time with Nurse"] = [0.0]
self.results_df.set_index("Patient ID", inplace=True)
# Create an attribute to store the mean queuing times across this run of
# the model
self.mean_q_time_cubicle = 0
# create distributions
# Triage duration
self.triage_dist = Exponential(g.triage_mean,
random_seed=self.run_number*g.random_number_set)
# Registration duration (non-trauma only)
self.reg_dist = Lognormal(g.reg_mean,
np.sqrt(g.reg_var),
random_seed=self.run_number*g.random_number_set)
# Evaluation (non-trauma only)
self.exam_dist = Normal(g.exam_mean,
np.sqrt(g.exam_var),
random_seed=self.run_number*g.random_number_set)
# Trauma/stablisation duration (trauma only)
self.trauma_dist = Exponential(g.trauma_mean,
random_seed=self.run_number*g.random_number_set)
# Non-trauma treatment
self.nt_treat_dist = Lognormal(g.non_trauma_treat_mean,
np.sqrt(g.non_trauma_treat_var),
random_seed=self.run_number*g.random_number_set)
# treatment of trauma patients
self.treat_dist = Lognormal(g.trauma_treat_mean,
np.sqrt(g.non_trauma_treat_var),
random_seed=self.run_number*g.random_number_set)
# probability of non-trauma patient requiring treatment
self.nt_p_treat_dist = Bernoulli(g.non_trauma_treat_p,
random_seed=self.run_number*g.random_number_set)
# probability of non-trauma versus trauma patient
self.p_trauma_dist = Bernoulli(g.prob_trauma,
random_seed=self.run_number*g.random_number_set)
# init sampling for non-stationary poisson process
self.init_nspp()
def init_nspp(self):
# read arrival profile
self.arrivals = pd.read_csv(g.arrival_df) # pylint: disable=attribute-defined-outside-init
self.arrivals['mean_iat'] = 60 / self.arrivals['arrival_rate']
# maximum arrival rate (smallest time between arrivals)
self.lambda_max = self.arrivals['arrival_rate'].max() # pylint: disable=attribute-defined-outside-init
# thinning exponential
self.arrival_dist = Exponential(60.0 / self.lambda_max, # pylint: disable=attribute-defined-outside-init
random_seed=self.run_number*g.random_number_set)
# thinning uniform rng
self.thinning_rng = Uniform(low=0.0, high=1.0, # pylint: disable=attribute-defined-outside-init
random_seed=self.run_number*g.random_number_set)
def init_resources(self):
'''
Init the number of resources
and store in the arguments container object
Resource list:
1. Nurses/treatment bays (same thing in this model)
'''
# Shared Resources
self.triage_cubicles = simpy.Store(self.env)
populate_store(num_resources=g.n_triage,
simpy_store=self.triage_cubicles,
sim_env=self.env)
self.registration_cubicles = simpy.Store(self.env)
populate_store(num_resources=g.n_reg,
simpy_store=self.registration_cubicles,
sim_env=self.env)
# Non-trauma
self.exam_cubicles = simpy.Store(self.env)
populate_store(num_resources=g.n_exam,
simpy_store=self.exam_cubicles,
sim_env=self.env)
self.non_trauma_treatment_cubicles = simpy.Store(self.env)
populate_store(num_resources=g.n_cubicles_non_trauma_treat,
simpy_store=self.non_trauma_treatment_cubicles,
sim_env=self.env)
# Trauma
self.trauma_stabilisation_bays = simpy.Store(self.env)
populate_store(num_resources=g.n_trauma,
simpy_store=self.trauma_stabilisation_bays,
sim_env=self.env)
self.trauma_treatment_cubicles = simpy.Store(self.env)
populate_store(num_resources=g.n_cubicles_trauma_treat,
simpy_store=self.trauma_treatment_cubicles,
sim_env=self.env)
# A generator function that represents the DES generator for patient
# arrivals
def generator_patient_arrivals(self):
# We use an infinite loop here to keep doing this indefinitely whilst
# the simulation runs
while True:
t = int(self.env.now // 60) % self.arrivals.shape[0]
lambda_t = self.arrivals['arrival_rate'].iloc[t]
# set to a large number so that at least 1 sample taken!
u = np.Inf
interarrival_time = 0.0
# reject samples if u >= lambda_t / lambda_max
while u >= (lambda_t / self.lambda_max):
interarrival_time += self.arrival_dist.sample()
u = self.thinning_rng.sample()
# Freeze this instance of this function in place until the
# inter-arrival time we sampled above has elapsed. Note - time in
# SimPy progresses in "Time Units", which can represent anything
# you like (just make sure you're consistent within the model)
yield self.env.timeout(interarrival_time)
# Increment the patient counter by 1 (this means our first patient
# will have an ID of 1)
self.patient_counter += 1
# Create a new patient - an instance of the Patient Class we
# defined above. Remember, we pass in the ID when creating a
# patient - so here we pass the patient counter to use as the ID.
p = Patient(self.patient_counter)
trace(f'patient {self.patient_counter} arrives at: {self.env.now:.3f}')
self.event_log.append(
{'patient': self.patient_counter,
'pathway': 'Shared',
'event': 'arrival',
'event_type': 'arrival_departure',
'time': self.env.now}
)
# sample if the patient is trauma or non-trauma
trauma = self.p_trauma_dist.sample()
# Tell SimPy to start up the attend_clinic generator function with
# this patient (the generator function that will model the
# patient's journey through the system)
# and store patient in list for later easy access
if trauma:
# create and store a trauma patient to update KPIs.
self.trauma_patients.append(p)
self.env.process(self.attend_trauma_pathway(p))
else:
# create and store a non-trauma patient to update KPIs.
self.non_trauma_patients.append(p)
self.env.process(self.attend_non_trauma_pathway(p))
# A generator function that represents the pathway for a patient going
# through the clinic.
# The patient object is passed in to the generator function so we can
# extract information from / record information to it
def attend_non_trauma_pathway(self, patient):
'''
simulates the non-trauma/minor treatment process for a patient
1. request and wait for sign-in/triage
2. patient registration
3. examination
4a. percentage discharged
4b. remaining percentage treatment then discharge
'''
# record the time of arrival and entered the triage queue
patient.arrival = self.env.now
self.event_log.append(
{'patient': patient.identifier,
'pathway': 'Non-Trauma',
'event_type': 'queue',
'event': 'triage_wait_begins',
'time': self.env.now}
)
###################################################
# request sign-in/triage
triage_resource = yield self.triage_cubicles.get()
# record the waiting time for triage
patient.wait_triage = self.env.now - patient.arrival
trace(f'patient {patient.identifier} triaged to minors '
f'{self.env.now:.3f}')
self.event_log.append(
{'patient': patient.identifier,
'pathway': 'Non-Trauma',
'event_type': 'resource_use',
'event': 'triage_begins',
'time': self.env.now,
'resource_id': triage_resource.id_attribute
}
)
# sample triage duration.
patient.triage_duration = self.triage_dist.sample()
yield self.env.timeout(patient.triage_duration)
trace(f'triage {patient.identifier} complete {self.env.now:.3f}; '
f'waiting time was {patient.wait_triage:.3f}')
self.event_log.append(
{'patient': patient.identifier,
'pathway': 'Non-Trauma',
'event_type': 'resource_use_end',
'event': 'triage_complete',
'time': self.env.now,
'resource_id': triage_resource.id_attribute}
)
# Resource is no longer in use, so put it back in the store
self.triage_cubicles.put(triage_resource)
#########################################################
# record the time that entered the registration queue
start_wait = self.env.now
self.event_log.append(
{'patient': patient.identifier,
'pathway': 'Non-Trauma',
'event_type': 'queue',
'event': 'MINORS_registration_wait_begins',
'time': self.env.now}
)
#########################################################
# request registration clerk
registration_resource = yield self.registration_cubicles.get()
# record the waiting time for registration
patient.wait_reg = self.env.now - start_wait
trace(f'registration of patient {patient.identifier} at '
f'{self.env.now:.3f}')
self.event_log.append(
{'patient': patient.identifier,
'pathway': 'Non-Trauma',
'event_type': 'resource_use',
'event': 'MINORS_registration_begins',
'time': self.env.now,
'resource_id': registration_resource.id_attribute
}
)
# sample registration duration.
patient.reg_duration = self.reg_dist.sample()
yield self.env.timeout(patient.reg_duration)
trace(f'patient {patient.identifier} registered at'
f'{self.env.now:.3f}; '
f'waiting time was {patient.wait_reg:.3f}')
self.event_log.append(
{'patient': patient.identifier,
'pathway': 'Non-Trauma',
'event': 'MINORS_registration_complete',
'event_type': 'resource_use_end',
'time': self.env.now,
'resource_id': registration_resource.id_attribute}
)
# Resource is no longer in use, so put it back in the store
self.registration_cubicles.put(registration_resource)
########################################################
# record the time that entered the evaluation queue
start_wait = self.env.now
self.event_log.append(
{'patient': patient.identifier,
'pathway': 'Non-Trauma',
'event': 'MINORS_examination_wait_begins',
'event_type': 'queue',
'time': self.env.now}
)
#########################################################
# request examination resource
examination_resource = yield self.exam_cubicles.get()
# record the waiting time for examination to begin
patient.wait_exam = self.env.now - start_wait
trace(f'examination of patient {patient.identifier} begins '
f'{self.env.now:.3f}')
self.event_log.append(
{'patient': patient.identifier,
'pathway': 'Non-Trauma',
'event': 'MINORS_examination_begins',
'event_type': 'resource_use',
'time': self.env.now,
'resource_id': examination_resource.id_attribute
}
)
# sample examination duration.
patient.exam_duration = self.exam_dist.sample()
yield self.env.timeout(patient.exam_duration)
trace(f'patient {patient.identifier} examination complete '
f'at {self.env.now:.3f};'
f'waiting time was {patient.wait_exam:.3f}')
self.event_log.append(
{'patient': patient.identifier,
'pathway': 'Non-Trauma',
'event': 'MINORS_examination_complete',
'event_type': 'resource_use_end',
'time': self.env.now,
'resource_id': examination_resource.id_attribute}
)
# Resource is no longer in use, so put it back in
self.exam_cubicles.put(examination_resource)
############################################################################
# sample if patient requires treatment?
patient.require_treat = self.nt_p_treat_dist.sample() #pylint: disable=attribute-defined-outside-init
if patient.require_treat:
self.event_log.append(
{'patient': patient.identifier,
'pathway': 'Non-Trauma',
'event': 'requires_treatment',
'event_type': 'attribute_assigned',
'time': self.env.now}
)
# record the time that entered the treatment queue
start_wait = self.env.now
self.event_log.append(
{'patient': patient.identifier,
'pathway': 'Non-Trauma',
'event': 'MINORS_treatment_wait_begins',
'event_type': 'queue',
'time': self.env.now}
)
###################################################
# request treatment cubicle
non_trauma_treatment_resource = yield self.non_trauma_treatment_cubicles.get()
# record the waiting time for treatment
patient.wait_treat = self.env.now - start_wait
trace(f'treatment of patient {patient.identifier} begins '
f'{self.env.now:.3f}')
self.event_log.append(
{'patient': patient.identifier,
'pathway': 'Non-Trauma',
'event': 'MINORS_treatment_begins',
'event_type': 'resource_use',
'time': self.env.now,
'resource_id': non_trauma_treatment_resource.id_attribute
}
)
# sample treatment duration.
patient.treat_duration = self.nt_treat_dist.sample()
yield self.env.timeout(patient.treat_duration)
trace(f'patient {patient.identifier} treatment complete '
f'at {self.env.now:.3f};'
f'waiting time was {patient.wait_treat:.3f}')
self.event_log.append(
{'patient': patient.identifier,
'pathway': 'Non-Trauma',
'event': 'MINORS_treatment_complete',
'event_type': 'resource_use_end',
'time': self.env.now,
'resource_id': non_trauma_treatment_resource.id_attribute}
)
# Resource is no longer in use, so put it back in the store
self.non_trauma_treatment_cubicles.put(non_trauma_treatment_resource)
##########################################################################
# Return to what happens to all patients, regardless of whether they were sampled as needing treatment
self.event_log.append(
{'patient': patient.identifier,
'pathway': 'Shared',
'event': 'depart',
'event_type': 'arrival_departure',
'time': self.env.now}
)
# total time in system
patient.total_time = self.env.now - patient.arrival
def attend_trauma_pathway(self, patient):
'''
simulates the major treatment process for a patient
1. request and wait for sign-in/triage
2. trauma
3. treatment
'''
# record the time of arrival and entered the triage queue
patient.arrival = self.env.now
self.event_log.append(
{'patient': patient.identifier,
'pathway': 'Trauma',
'event_type': 'queue',
'event': 'triage_wait_begins',
'time': self.env.now}
)
###################################################
# request sign-in/triage
triage_resource = yield self.triage_cubicles.get()
# record the waiting time for triage
patient.wait_triage = self.env.now - patient.arrival
trace(f'patient {patient.identifier} triaged to trauma '
f'{self.env.now:.3f}')
self.event_log.append(
{'patient': patient.identifier,
'pathway': 'Trauma',
'event_type': 'resource_use',
'event': 'triage_begins',
'time': self.env.now,
'resource_id': triage_resource.id_attribute
}
)
# sample triage duration.
patient.triage_duration = self.triage_dist.sample()
yield self.env.timeout(patient.triage_duration)
trace(f'triage {patient.identifier} complete {self.env.now:.3f}; '
f'waiting time was {patient.wait_triage:.3f}')
self.event_log.append(
{'patient': patient.identifier,
'pathway': 'Trauma',
'event_type': 'resource_use_end',
'event': 'triage_complete',
'time': self.env.now,
'resource_id': triage_resource.id_attribute}
)
# Resource is no longer in use, so put it back in the store
self.triage_cubicles.put(triage_resource)
###################################################
# record the time that entered the trauma queue
start_wait = self.env.now
self.event_log.append(
{'patient': patient.identifier,
'pathway': 'Trauma',
'event_type': 'queue',
'event': 'TRAUMA_stabilisation_wait_begins',
'time': self.env.now}
)
###################################################
# request trauma room
trauma_resource = yield self.trauma_stabilisation_bays.get()
self.event_log.append(
{'patient': patient.identifier,
'pathway': 'Trauma',
'event_type': 'resource_use',
'event': 'TRAUMA_stabilisation_begins',
'time': self.env.now,
'resource_id': trauma_resource.id_attribute
}
)
# record the waiting time for trauma
patient.wait_trauma = self.env.now - start_wait
# sample stablisation duration.
patient.trauma_duration = self.trauma_dist.sample()
yield self.env.timeout(patient.trauma_duration)
trace(f'stabilisation of patient {patient.identifier} at '
f'{self.env.now:.3f}')
self.event_log.append(
{'patient': patient.identifier,
'pathway': 'Trauma',
'event_type': 'resource_use_end',
'event': 'TRAUMA_stabilisation_complete',
'time': self.env.now,
'resource_id': trauma_resource.id_attribute
}
)
# Resource is no longer in use, so put it back in the store
self.trauma_stabilisation_bays.put(trauma_resource)
#######################################################
# record the time that patient entered the treatment queue
start_wait = self.env.now
self.event_log.append(
{'patient': patient.identifier,
'pathway': 'Trauma',
'event_type': 'queue',
'event': 'TRAUMA_treatment_wait_begins',
'time': self.env.now}
)
########################################################
# request treatment cubicle
trauma_treatment_resource = yield self.trauma_treatment_cubicles.get()
# record the waiting time for trauma
patient.wait_treat = self.env.now - start_wait
trace(f'treatment of patient {patient.identifier} at '
f'{self.env.now:.3f}')
self.event_log.append(
{'patient': patient.identifier,
'pathway': 'Trauma',
'event_type': 'resource_use',
'event': 'TRAUMA_treatment_begins',
'time': self.env.now,
'resource_id': trauma_treatment_resource.id_attribute
}
)
# sample treatment duration.
patient.treat_duration = self.trauma_dist.sample()
yield self.env.timeout(patient.treat_duration)
trace(f'patient {patient.identifier} treatment complete {self.env.now:.3f}; '
f'waiting time was {patient.wait_treat:.3f}')
self.event_log.append(
{'patient': patient.identifier,
'pathway': 'Trauma',
'event_type': 'resource_use_end',
'event': 'TRAUMA_treatment_complete',
'time': self.env.now,
'resource_id': trauma_treatment_resource.id_attribute}
)
self.event_log.append(
{'patient': patient.identifier,
'pathway': 'Shared',
'event': 'depart',
'event_type': 'arrival_departure',
'time': self.env.now}
)
# Resource is no longer in use, so put it back in the store
self.trauma_treatment_cubicles.put(trauma_treatment_resource)
#########################################################
# total time in system
patient.total_time = self.env.now - patient.arrival
# This method calculates results over a single run. Here we just calculate
# a mean, but in real world models you'd probably want to calculate more.
def calculate_run_results(self):
# Take the mean of the queuing times across patients in this run of the
# model.
self.mean_q_time_cubicle = self.results_df["Queue Time Cubicle"].mean()
# The run method starts up the DES entity generators, runs the simulation,
# and in turns calls anything we need to generate results for the run
def run(self):
# Start up our DES entity generators that create new patients. We've
# only got one in this model, but we'd need to do this for each one if
# we had multiple generators.
self.env.process(self.generator_patient_arrivals())
# Run the model for the duration specified in g class
self.env.run(until=g.sim_duration)
# Now the simulation run has finished, call the method that calculates
# run results
self.calculate_run_results()
self.event_log = pd.DataFrame(self.event_log)
self.event_log["run"] = self.run_number
return {'results': self.results_df, 'event_log': self.event_log}
# Class representing a Trial for our simulation - a batch of simulation runs.
class Trial:
# The constructor sets up a pandas dataframe that will store the key
# results from each run against run number, with run number as the index.
def __init__(self):
self.df_trial_results = pd.DataFrame()
self.df_trial_results["Run Number"] = [0]
self.df_trial_results["Arrivals"] = [0]
self.df_trial_results["Mean Queue Time Cubicle"] = [0.0]
self.df_trial_results.set_index("Run Number", inplace=True)
self.all_event_logs = []
# Method to run a trial
def run_trial(self):
# Run the simulation for the number of runs specified in g class.
# For each run, we create a new instance of the Model class and call its
# run method, which sets everything else in motion. Once the run has
# completed, we grab out the stored run results (just mean queuing time
# here) and store it against the run number in the trial results
# dataframe.
for run in range(g.number_of_runs):
random.seed(run)
my_model = Model(run)
model_outputs = my_model.run()
patient_level_results = model_outputs["results"]
event_log = model_outputs["event_log"]
self.df_trial_results.loc[run] = [
len(patient_level_results),
my_model.mean_q_time_cubicle,
]
# print(event_log)
self.all_event_logs.append(event_log)
self.all_event_logs = pd.concat(self.all_event_logs)my_trial = Trial()
my_trial.run_trial()
my_trial.all_event_logs.head(10) patient pathway ... resource_id run
0 1 Shared ... NaN 0
1 1 Non-Trauma ... NaN 0
2 1 Non-Trauma ... 1.0 0
3 2 Shared ... NaN 0
4 2 Non-Trauma ... NaN 0
5 2 Non-Trauma ... 2.0 0
6 1 Non-Trauma ... 1.0 0
7 1 Non-Trauma ... NaN 0
8 1 Non-Trauma ... 1.0 0
9 2 Non-Trauma ... 2.0 0
[10 rows x 7 columns]my_trial.all_event_logs.event_type.value_counts()event_type
queue 2100
resource_use 2035
resource_use_end 2021
arrival_departure 1167
attribute_assigned 264
Name: count, dtype: int64my_trial.all_event_logs.event.value_counts()event
arrival 623
triage_wait_begins 623
triage_begins 622
triage_complete 620
depart 544
MINORS_registration_wait_begins 539
MINORS_registration_begins 514
MINORS_registration_complete 512
MINORS_examination_wait_begins 512
MINORS_examination_begins 475
MINORS_examination_complete 472
requires_treatment 264
MINORS_treatment_wait_begins 264
MINORS_treatment_begins 264
MINORS_treatment_complete 262
TRAUMA_stabilisation_wait_begins 81
TRAUMA_stabilisation_begins 81
TRAUMA_stabilisation_complete 81
TRAUMA_treatment_wait_begins 81
TRAUMA_treatment_begins 79
TRAUMA_treatment_complete 74
Name: count, dtype: int64# First, identify all patients who have a 'depart' event
# patients_with_depart = my_trial.all_event_logs[my_trial.all_event_logs['event'].str.contains('depart')]['patient'].unique()
# Then filter the original DataFrame to only include those patients
# filtered_df = my_trial.all_event_logs[my_trial.all_event_logs['patient'].isin(patients_with_depart)]
logs_transformed = my_trial.all_event_logs[~my_trial.all_event_logs['event'].str.contains('wait')].copy()
# logs_transformed = filtered_df[~filtered_df['event'].str.contains('wait')].copy()
logs_transformed = logs_transformed[logs_transformed['event_type'].isin(['resource_use', 'resource_use_end'])].copy()
logs_transformed['event_stage'] = logs_transformed['event_type'].apply(lambda x: 'complete' if 'end' in x else 'start')
logs_transformed['event_name'] = logs_transformed['event'].str.replace('_begins|_complete', '', regex=True)
logs_transformed['resource_id_full'] = logs_transformed.apply(lambda x: f"{x['event_name']}_{x['resource_id']:.0f}", axis=1)
logs_transformed = logs_transformed.sort_values(['run', 'time'], ascending=True)
# logs_transformed["activity_id"] = (
# logs_transformed.groupby(["run", "patient", "event_name"]).ngroup() + 1
# )
# logs_transformed = logs_transformed.sort_values(["run", "patient", "activity_id", "event_stage"], ascending=[True, True, True, False])
# Sort the data by run, patient, time, and event_name to handle tied start times
logs_transformed = logs_transformed.sort_values(["run", "patient", "time", "event_name"])
# Get the first occurrence of each activity (the start event)
first_occurrences = (
logs_transformed[logs_transformed["event_stage"] == "start"]
.drop_duplicates(["run", "patient", "event_name"])
.copy()
)
# Sort by time within each run to determine the proper sequence
first_occurrences = first_occurrences.sort_values(["run", "time", "event_name"])
# Assign sequential activity_id within each run
first_occurrences["activity_id"] = first_occurrences.groupby("run").cumcount() + 1
# Merge the activity_id back to the main DataFrame
logs_transformed = logs_transformed.merge(
first_occurrences[["run", "patient", "event_name", "activity_id"]],
on=["run", "patient", "event_name"],
how="left"
)
# Sort for final ordering
logs_transformed = logs_transformed.sort_values(
["run", "patient", "activity_id", "event_stage"],
ascending=[True, True, True, False]
)
logs_transformed.head(50) patient pathway ... resource_id_full activity_id
0 1 Non-Trauma ... triage_1 1
2 1 Non-Trauma ... triage_1 1
1 1 Non-Trauma ... MINORS_registration_1 3
4 1 Non-Trauma ... MINORS_registration_1 3
3 1 Non-Trauma ... MINORS_examination_1 5
5 1 Non-Trauma ... MINORS_examination_1 5
6 2 Non-Trauma ... triage_2 2
8 2 Non-Trauma ... triage_2 2
7 2 Non-Trauma ... MINORS_registration_2 4
10 2 Non-Trauma ... MINORS_registration_2 4
9 2 Non-Trauma ... MINORS_examination_2 6
11 2 Non-Trauma ... MINORS_examination_2 6
12 2 Non-Trauma ... MINORS_treatment_1 7
13 2 Non-Trauma ... MINORS_treatment_1 7
14 3 Non-Trauma ... triage_1 8
16 3 Non-Trauma ... triage_1 8
15 3 Non-Trauma ... MINORS_registration_1 9
18 3 Non-Trauma ... MINORS_registration_1 9
17 3 Non-Trauma ... MINORS_examination_3 12
19 3 Non-Trauma ... MINORS_examination_3 12
20 3 Non-Trauma ... MINORS_treatment_2 16
21 3 Non-Trauma ... MINORS_treatment_2 16
22 4 Non-Trauma ... triage_2 10
24 4 Non-Trauma ... triage_2 10
23 4 Non-Trauma ... MINORS_registration_2 11
26 4 Non-Trauma ... MINORS_registration_2 11
25 4 Non-Trauma ... MINORS_examination_1 13
27 4 Non-Trauma ... MINORS_examination_1 13
28 4 Non-Trauma ... MINORS_treatment_3 17
29 4 Non-Trauma ... MINORS_treatment_3 17
30 5 Non-Trauma ... triage_1 14
32 5 Non-Trauma ... triage_1 14
31 5 Non-Trauma ... MINORS_registration_1 15
34 5 Non-Trauma ... MINORS_registration_1 15
33 5 Non-Trauma ... MINORS_examination_2 18
35 5 Non-Trauma ... MINORS_examination_2 18
36 6 Trauma ... triage_2 19
38 6 Trauma ... triage_2 19
37 6 Trauma ... TRAUMA_stabilisation_1 21
39 6 Trauma ... TRAUMA_stabilisation_1 21
40 6 Trauma ... TRAUMA_treatment_1 37
41 6 Trauma ... TRAUMA_treatment_1 37
42 7 Non-Trauma ... triage_1 20
44 7 Non-Trauma ... triage_1 20
43 7 Non-Trauma ... MINORS_registration_2 23
46 7 Non-Trauma ... MINORS_registration_2 23
45 7 Non-Trauma ... MINORS_examination_3 27
47 7 Non-Trauma ... MINORS_examination_3 27
48 8 Non-Trauma ... triage_2 22
50 8 Non-Trauma ... triage_2 22
[50 rows x 11 columns]logs_transformed[logs_transformed["activity_id"]==26].sort_values('run').head(30) patient pathway event ... event_name resource_id_full activity_id
60 10 Trauma triage_begins ... triage triage_2 26
62 10 Trauma triage_complete ... triage triage_2 26
[2 rows x 11 columns]logs_transformed.sort_values('activity_id').head(20) patient pathway ... resource_id_full activity_id
0 1 Non-Trauma ... triage_1 1
2 1 Non-Trauma ... triage_1 1
6 2 Non-Trauma ... triage_2 2
8 2 Non-Trauma ... triage_2 2
1 1 Non-Trauma ... MINORS_registration_1 3
4 1 Non-Trauma ... MINORS_registration_1 3
7 2 Non-Trauma ... MINORS_registration_2 4
10 2 Non-Trauma ... MINORS_registration_2 4
3 1 Non-Trauma ... MINORS_examination_1 5
5 1 Non-Trauma ... MINORS_examination_1 5
11 2 Non-Trauma ... MINORS_examination_2 6
9 2 Non-Trauma ... MINORS_examination_2 6
12 2 Non-Trauma ... MINORS_treatment_1 7
13 2 Non-Trauma ... MINORS_treatment_1 7
14 3 Non-Trauma ... triage_1 8
16 3 Non-Trauma ... triage_1 8
15 3 Non-Trauma ... MINORS_registration_1 9
18 3 Non-Trauma ... MINORS_registration_1 9
24 4 Non-Trauma ... triage_2 10
22 4 Non-Trauma ... triage_2 10
[20 rows x 11 columns]logs_transformed[["event_name", "event_stage", "event_type"]].value_counts()event_name event_stage event_type
triage start resource_use 622
complete resource_use_end 620
MINORS_registration start resource_use 514
complete resource_use_end 512
MINORS_examination start resource_use 475
complete resource_use_end 472
MINORS_treatment start resource_use 264
complete resource_use_end 262
TRAUMA_stabilisation complete resource_use_end 81
start resource_use 81
TRAUMA_treatment start resource_use 79
complete resource_use_end 74
Name: count, dtype: int64logs_transformed.event.value_counts()event
triage_begins 622
triage_complete 620
MINORS_registration_begins 514
MINORS_registration_complete 512
MINORS_examination_begins 475
MINORS_examination_complete 472
MINORS_treatment_begins 264
MINORS_treatment_complete 262
TRAUMA_stabilisation_begins 81
TRAUMA_stabilisation_complete 81
TRAUMA_treatment_begins 79
TRAUMA_treatment_complete 74
Name: count, dtype: int64For ease, now let’s save these results as a file that we can load into R.
We could use a csv for easy interoperability. Alternatively, we could use something like Feather or Parquet, which are usable by both R and Python while retaining data types.
For ease of use and long-term readbility, we will use csv in this case.
logs_transformed.to_csv('simulation_logs_for_bupar.csv', index=False)Moving to R - Exploring the bupaR package
Now, it’s time to move to R (as bupaR and the bupaverse is only implemented in R).
pm4py exists as a process analytics package for Python, but the visuals of bupaR are of a high quality.
Importing the required R functions and our data
library(dplyr)
Attaching package: 'dplyr'The following objects are masked from 'package:stats':
filter, lagThe following objects are masked from 'package:base':
intersect, setdiff, setequal, unionlibrary(readr)
library(bupaverse)Warning: package 'bupaverse' was built under R version 4.3.3
.______    __    __  .______      ___   ____    ____  _______ .______          _______. _______
|   _  \  |  |  |  | |   _  \    /   \  \   \  /   / |   ____||   _  \        /       ||   ____|
|  |_)  | |  |  |  | |  |_)  |  /  ^  \  \   \/   /  |  |__   |  |_)  |      |   (----`|  |__
|   _  <  |  |  |  | |   ___/  /  /_\  \  \      /   |   __|  |      /        \   \    |   __|
|  |_)  | |  `--'  | |  |     /  _____  \  \    /    |  |____ |  |\  \----.----)   |   |  |____
|______/   \______/  | _|    /__/     \__\  \__/     |_______|| _| `._____|_______/    |_______|
── Attaching packages ─────────────────────────────────────── bupaverse 0.1.0 ──
✔ bupaR         0.5.4     ✔ processcheckR 0.1.4
✔ edeaR         0.9.4     ✔ processmapR   0.5.6
✔ eventdataR    0.3.1
Warning: package 'bupaR' was built under R version 4.3.3Warning: package 'processcheckR' was built under R version 4.3.3── Conflicts ────────────────────────────────────────── bupaverse_conflicts() ──
✖ processcheckR::contains() masks dplyr::contains()
✖ bupaR::filter() masks dplyr::filter(), stats::filter()
✖ processmapR::frequency() masks stats::frequency()
✖ edeaR::setdiff() masks dplyr::setdiff(), base::setdiff()
✖ bupaR::timestamp() masks utils::timestamp()
✖ processcheckR::xor() masks base::xor()library(processanimateR)Warning: package 'processanimateR' was built under R version 4.3.3library(lubridate)
Attaching package: 'lubridate'

The following objects are masked from 'package:base':

date, intersect, setdiff, unionlibrary(DT)Warning: package 'DT' was built under R version 4.3.3library(psmineR)Warning: package 'psmineR' was built under R version 4.3.3data <- readr::read_csv("simulation_logs_for_bupar.csv")Rows: 4056 Columns: 11
── Column specification ────────────────────────────────────────────────────────
Delimiter: ","
chr (6): pathway, event, event_type, event_stage, event_name, resource_id_full
dbl (5): patient, time, resource_id, run, activity_id
ℹ Use `spec()` to retrieve the full column specification for this data.
ℹ Specify the column types or set `show_col_types = FALSE` to quiet this message.data %>% head()# A tibble: 6 × 11
patient pathway event event_type time resource_id run event_stage
<dbl> <chr> <chr> <chr> <dbl> <dbl> <dbl> <chr>
1 1 Non-Trauma triage_begi… resource_… 3.29 1 0 start
2 1 Non-Trauma triage_comp… resource_… 7.36 1 0 complete
3 1 Non-Trauma MINORS_regi… resource_… 7.36 1 0 start
4 1 Non-Trauma MINORS_regi… resource_… 15.4 1 0 complete
5 1 Non-Trauma MINORS_exam… resource_… 15.4 1 0 start
6 1 Non-Trauma MINORS_exam… resource_… 31.6 1 0 complete
# ℹ 3 more variables: event_name <chr>, resource_id_full <chr>,
# activity_id <dbl>Ensuring our data has the required time columns and is only for a single run
data_processed <- data %>%
    dplyr::filter(run == 0) %>%
    dplyr::rename(minutes_after_origin=time) %>%
    # We provide a theoretical date to act as a starting point - the date does not have to be
    # a true representation of the actual simulation, though you may wish it to be if there
    # are date elements in your simulation (e.g. within-week or within-year seasonality)
    dplyr::mutate(time = as.POSIXct("2024-01-01 00:00:00", tz = "UTC") + lubridate::dminutes(minutes_after_origin)) %>%
    bupaR::convert_timestamps("time", ymd_hms) %>%
    dplyr::mutate(patient = as.factor(patient))

DT::datatable(data_processed)
Converting to the activitylog format
activity_log <- data_processed  %>%
    bupaR::eventlog(
        case_id = "patient",
        activity_id = "event_name",
        activity_instance_id = "activity_id",
        lifecycle_id = "event_stage",
        timestamp = "time",
        resource_id = "resource_id_full"
        )

## !!!! Note that the bupaR documentation recommmends using the
## to_activitylog() function at the end of this set of steps.
## This caused significant errors in testing of this code, so
## I would not recommend following this recommendation, and instead
## you can mimic the above

activity_log
# Log of 4056 events consisting of:
6 traces
622 cases
2035 instances of 6 activities
20 resources
Events occurred from 2024-01-01 00:03:17 until 2024-01-03 01:58:40
# Variables were mapped as follows:
Case identifier: patient
Activity identifier: event_name
Resource identifier: resource_id_full
Activity instance identifier: activity_id
Timestamp: time
Lifecycle transition: event_stage
# A tibble: 4,056 × 13
patient pathway event event_type minutes_after_origin resource_id run
<fct> <chr> <chr> <chr> <dbl> <dbl> <dbl>
1 1 Non-Trauma triage_… resource_… 3.29 1 0
2 1 Non-Trauma triage_… resource_… 7.36 1 0
3 1 Non-Trauma MINORS_… resource_… 7.36 1 0
4 1 Non-Trauma MINORS_… resource_… 15.4 1 0
5 1 Non-Trauma MINORS_… resource_… 15.4 1 0
6 1 Non-Trauma MINORS_… resource_… 31.6 1 0
7 2 Non-Trauma triage_… resource_… 3.29 2 0
8 2 Non-Trauma triage_… resource_… 9.41 2 0
9 2 Non-Trauma MINORS_… resource_… 9.41 2 0
10 2 Non-Trauma MINORS_… resource_… 17.1 2 0
# ℹ 4,046 more rows
# ℹ 6 more variables: event_stage <chr>, event_name <chr>,
# resource_id_full <chr>, activity_id <dbl>, time <dttm>, .order <int>Creating outputs
Process Maps
Absolute frequencies
activity_log %>%
    process_map(frequency("absolute"))
activity_log %>%
process_map(frequency("absolute-case"))Relative frequencies
activity_log %>%
    process_map(frequency("relative"))
activity_log %>%
process_map(frequency("relative-case"),
render_options = list(edge_label_color = "white"))activity_log %>%
process_map(frequency("relative-consequent"),
render_options = list(edge_label_color = "white"))Performance Maps
Mean Waits
activity_log %>%
    process_map(performance())
Max Waits
activity_log %>%
    process_map(performance(FUN = max))
Warning: There was 1 warning in `summarize()`.
ℹ In argument: `label = do.call(...)`.
ℹ In group 9: `ACTIVITY_CLASSIFIER_ = NA` and `from_id = NA`.
Caused by warning in `type()`:
! no non-missing arguments to max; returning -InfWarning: There were 2 warnings in `summarize()`.
The first warning was:
ℹ In argument: `value = do.call(...)`.
ℹ In group 1: `ACTIVITY_CLASSIFIER_ = "ARTIFICIAL_END"`, `next_act = NA`,
`from_id = 1`, `to_id = NA`.
Caused by warning in `type()`:
! no non-missing arguments to max; returning -Inf
ℹ Run `dplyr::last_dplyr_warnings()` to see the 1 remaining warning.90th percentile
p90 <- function(x, ...) {
    quantile(x, probs = 0.9, ...)
}

activity_log %>%
    process_map(performance(FUN = p90))
Analytics
Take a look at this page in the bupaR docs details of each of these plots.
Idle Time
activity_log %>%
    idle_time("resource", units = "mins")
# A tibble: 20 × 2
resource_id_full idle_time
<chr> <drtn>
1 MINORS_treatment_1 2101.6612 mins
2 MINORS_treatment_2 2065.5869 mins
3 MINORS_treatment_3 2043.3483 mins
4 MINORS_treatment_4 1945.5681 mins
5 TRAUMA_treatment_1 1415.3914 mins
6 TRAUMA_treatment_2 1275.9829 mins
7 TRAUMA_treatment_3 1208.0795 mins
8 TRAUMA_treatment_5 1098.2404 mins
9 triage_2 1043.9654 mins
10 triage_1 999.9198 mins
11 TRAUMA_treatment_4 959.1452 mins
12 MINORS_registration_2 951.0949 mins
13 MINORS_registration_1 943.0261 mins
14 TRAUMA_stabilisation_1 881.6663 mins
15 TRAUMA_stabilisation_2 714.7071 mins
16 TRAUMA_stabilisation_3 691.9842 mins
17 TRAUMA_stabilisation_4 564.1900 mins
18 MINORS_examination_2 469.1167 mins
19 MINORS_examination_1 463.9669 mins
20 MINORS_examination_3 441.1148 minsactivity_log %>%
idle_time("resource", units = "mins") %>%
plot()
Processing Time
activity_log %>%
    processing_time("log", units = "mins") %>%
    plot()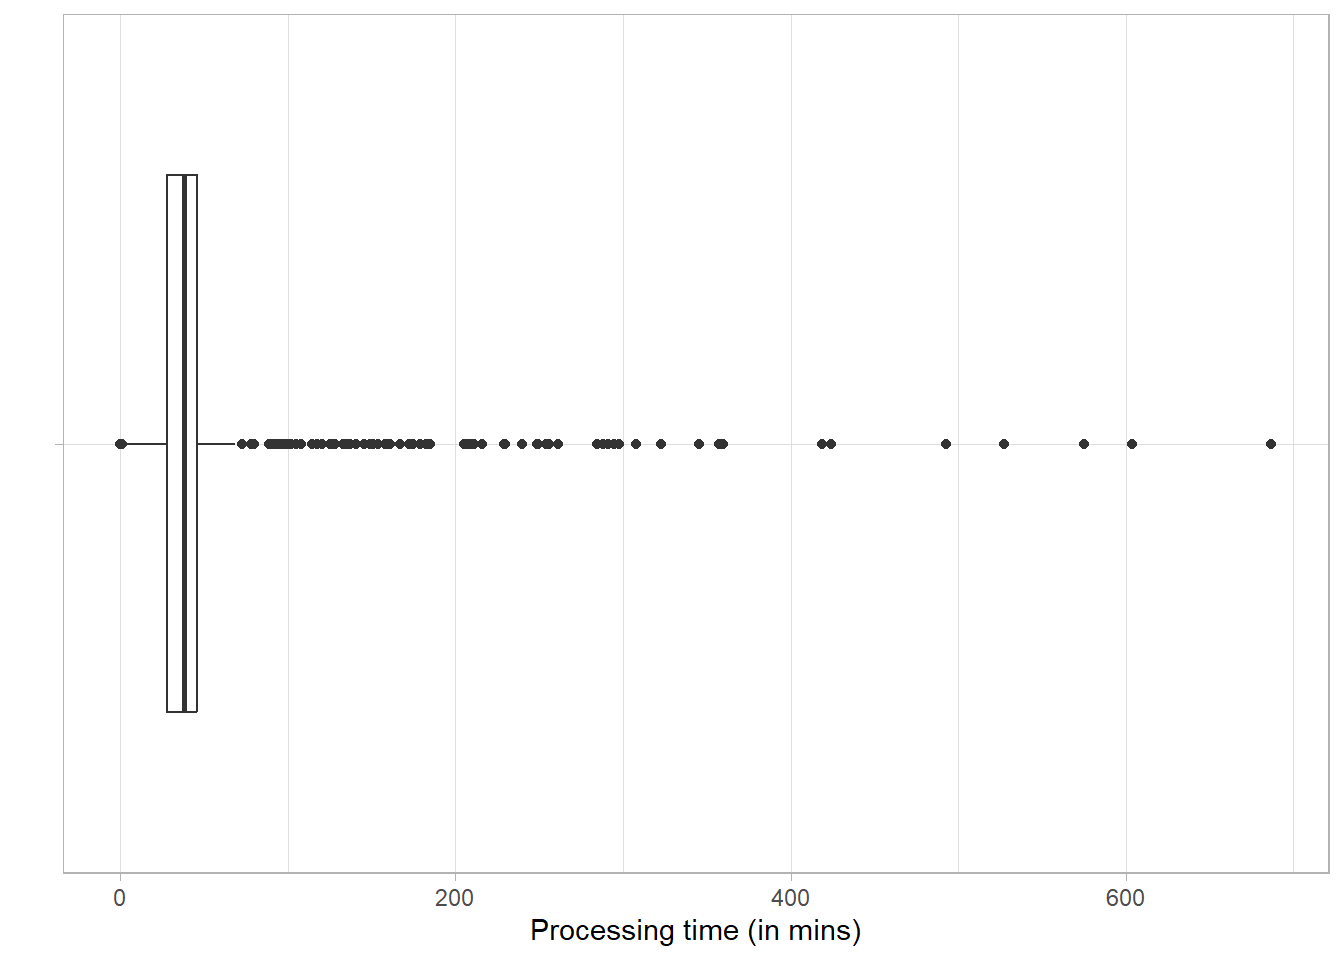
activity_log %>%
    processing_time("case", units = "mins") %>%
    plot()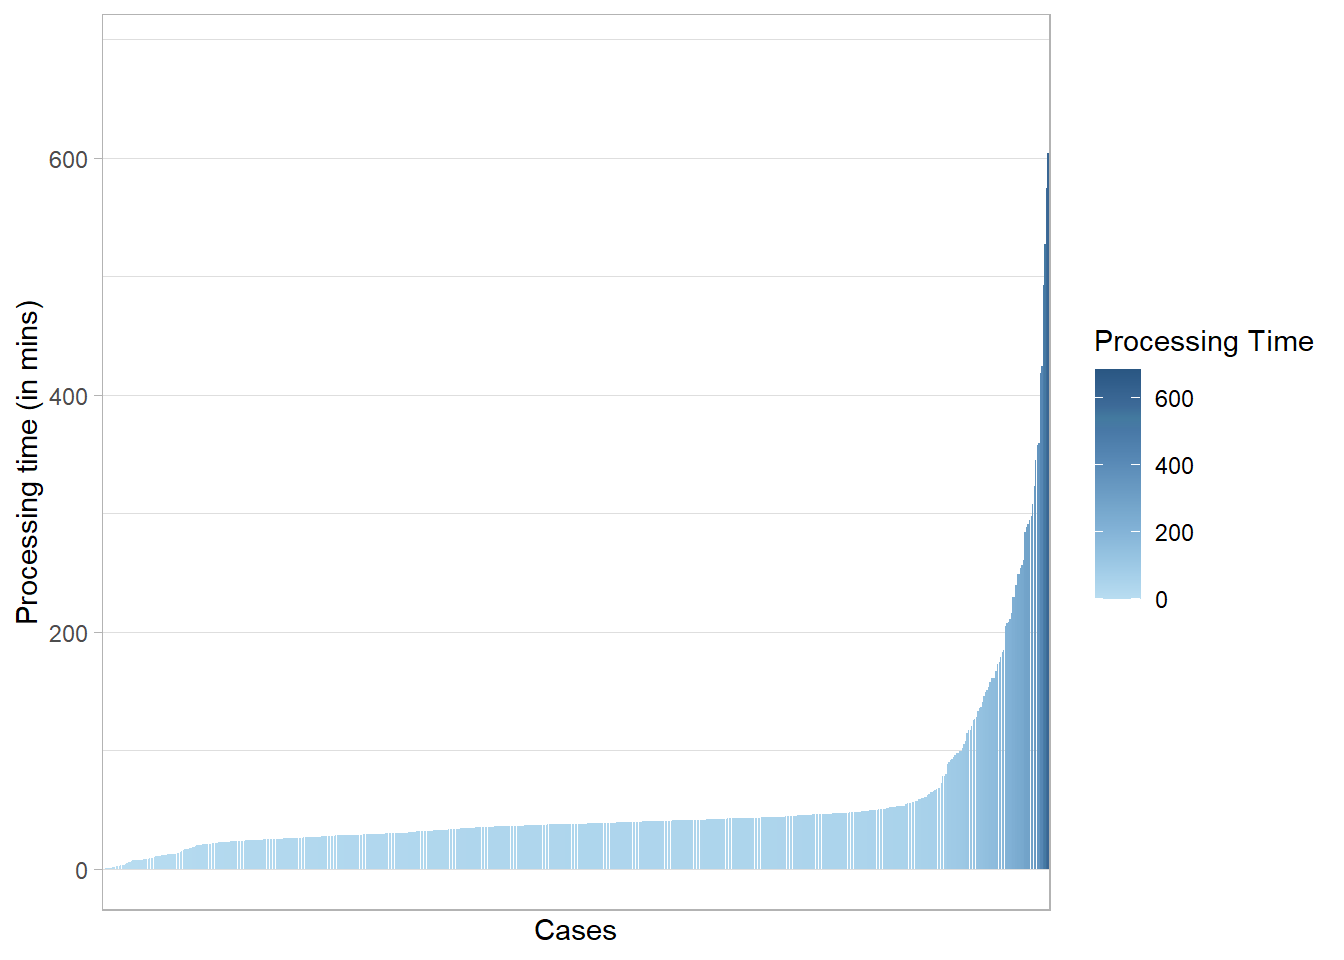
activity_log %>%
    processing_time("activity", units = "mins") %>%
    plot()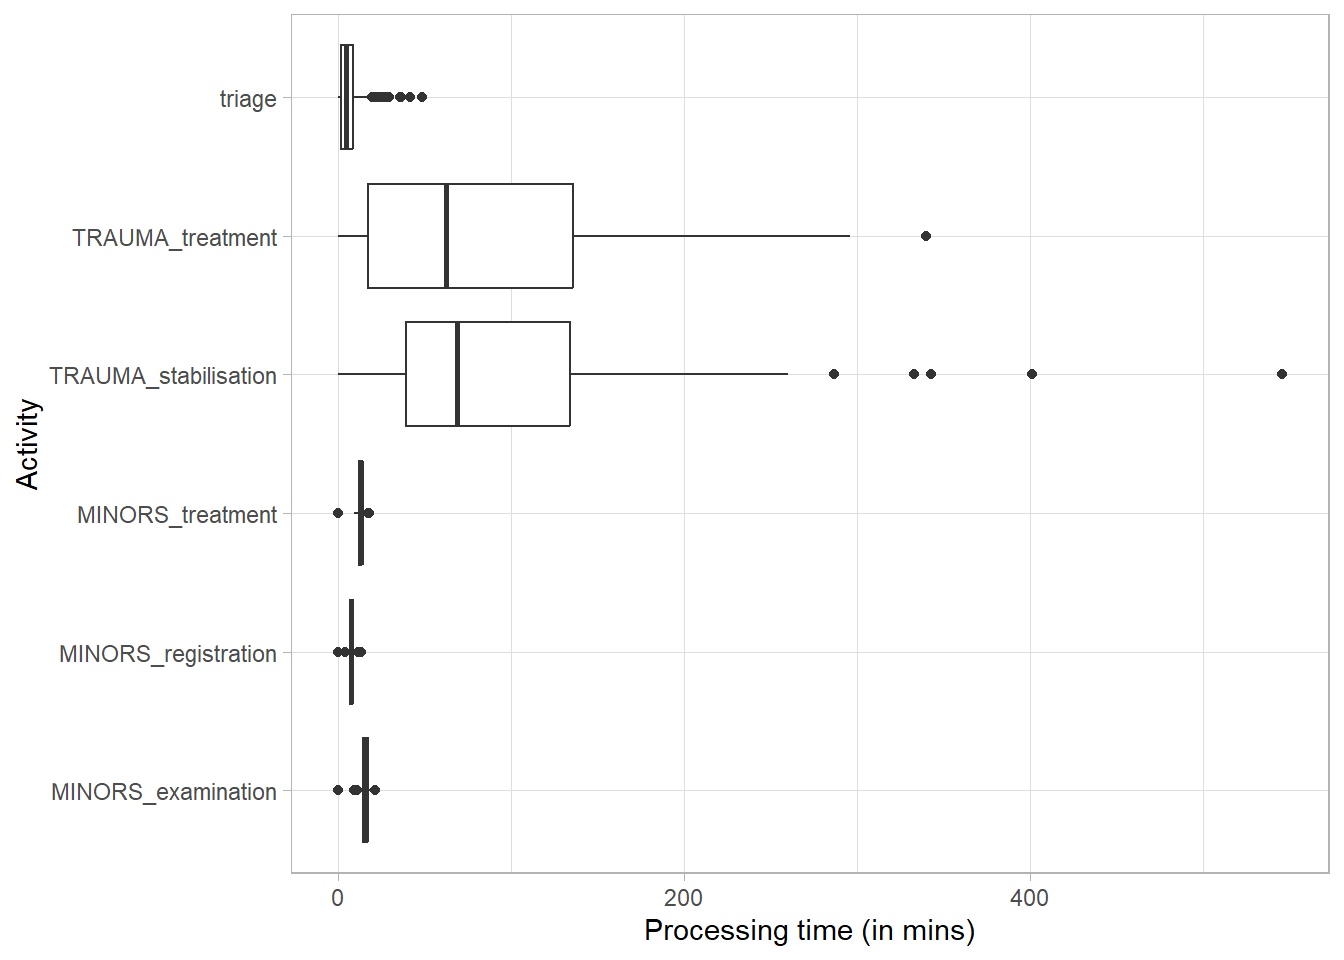
activity_log %>%
    processing_time("resource-activity", units = "mins") %>%
    plot()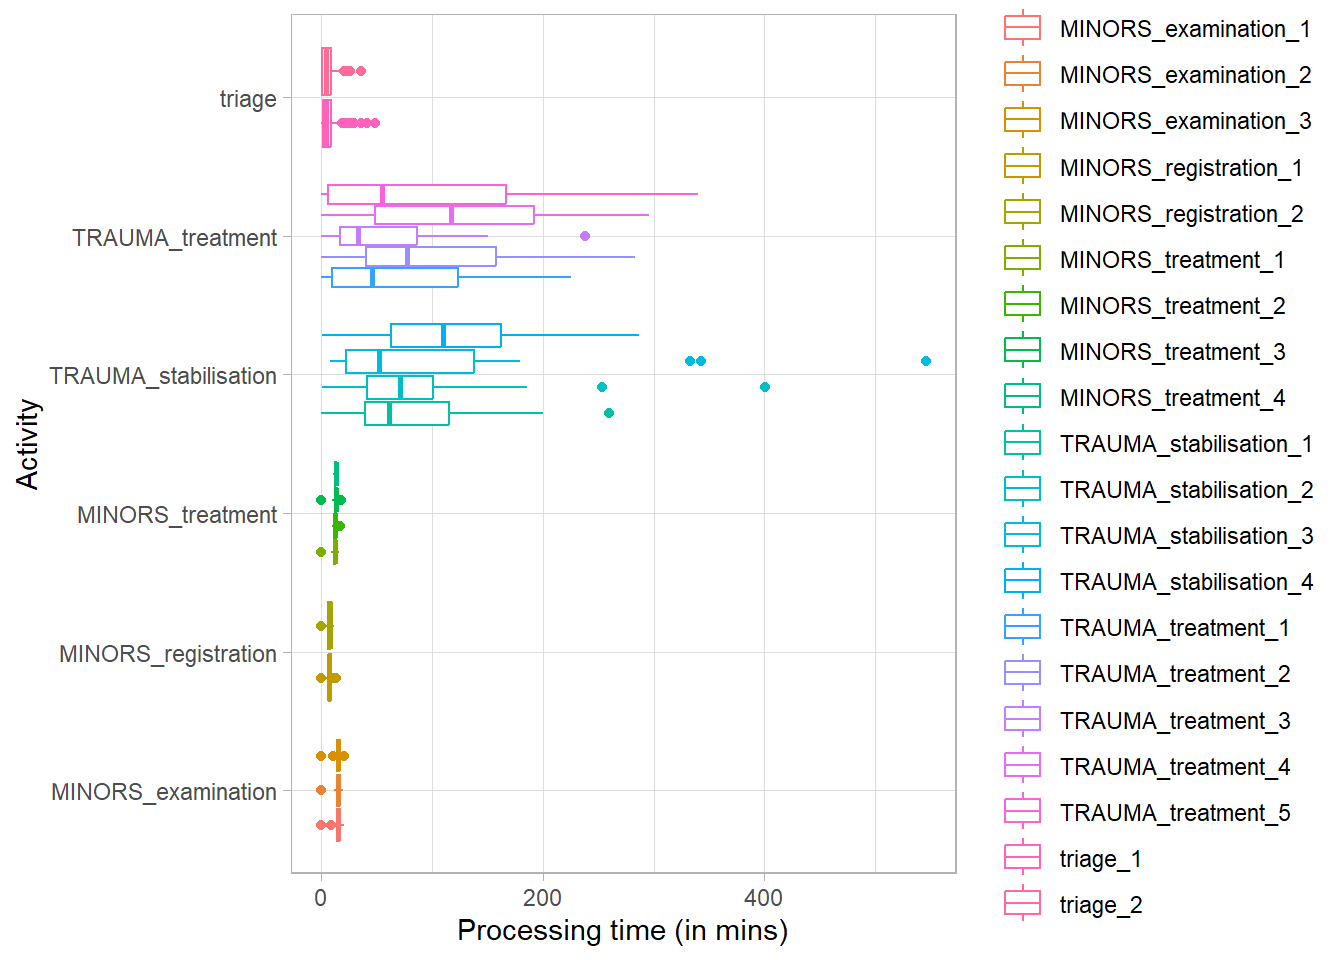
Throughput time
activity_log %>%
    throughput_time("log", units = "mins") %>%
    plot()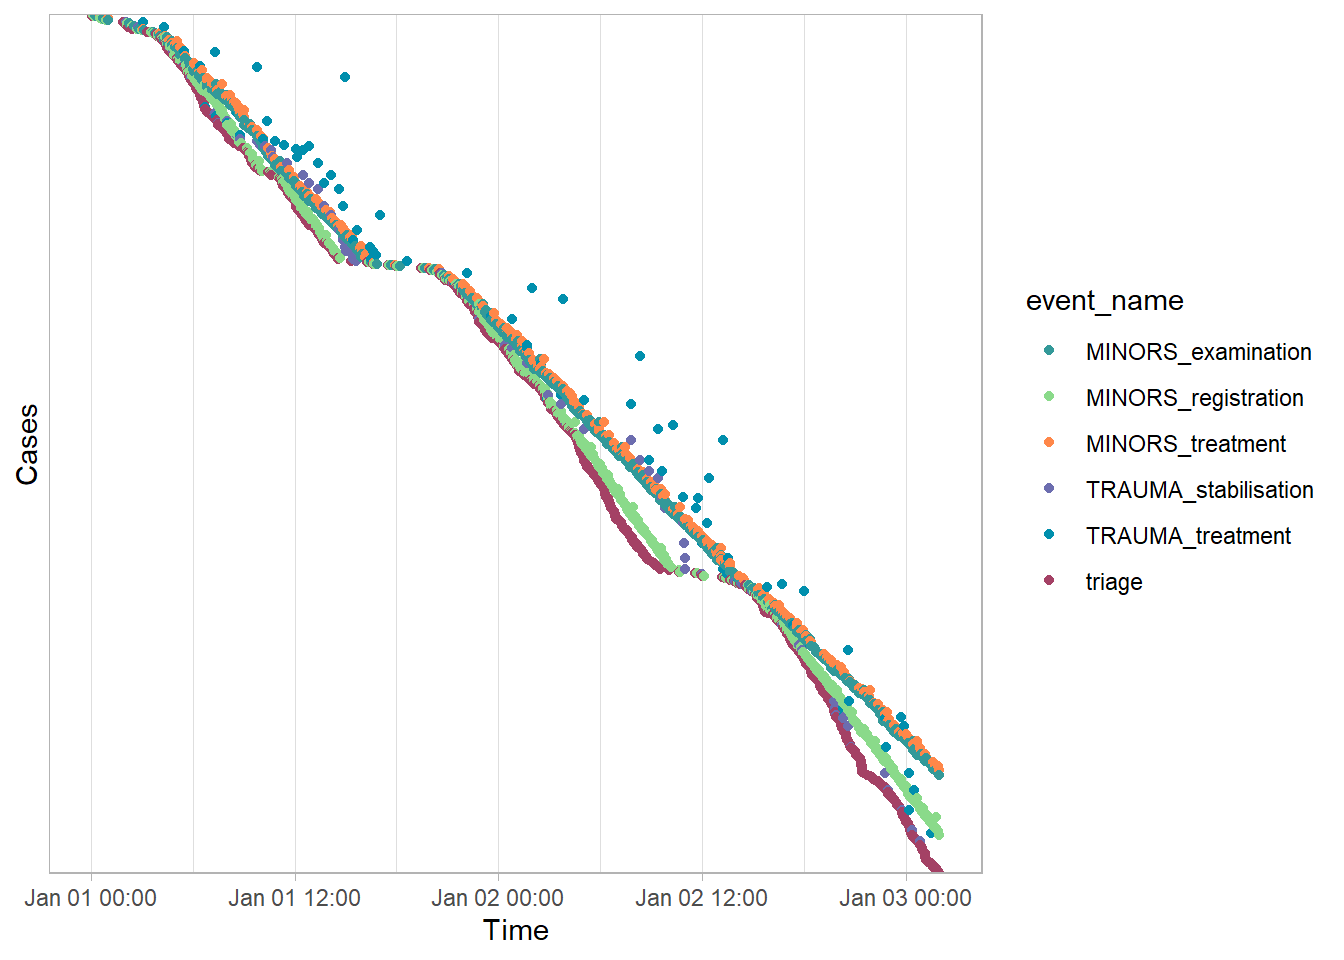
Activity Presence
activity_log %>%
    activity_presence() %>%
    plot()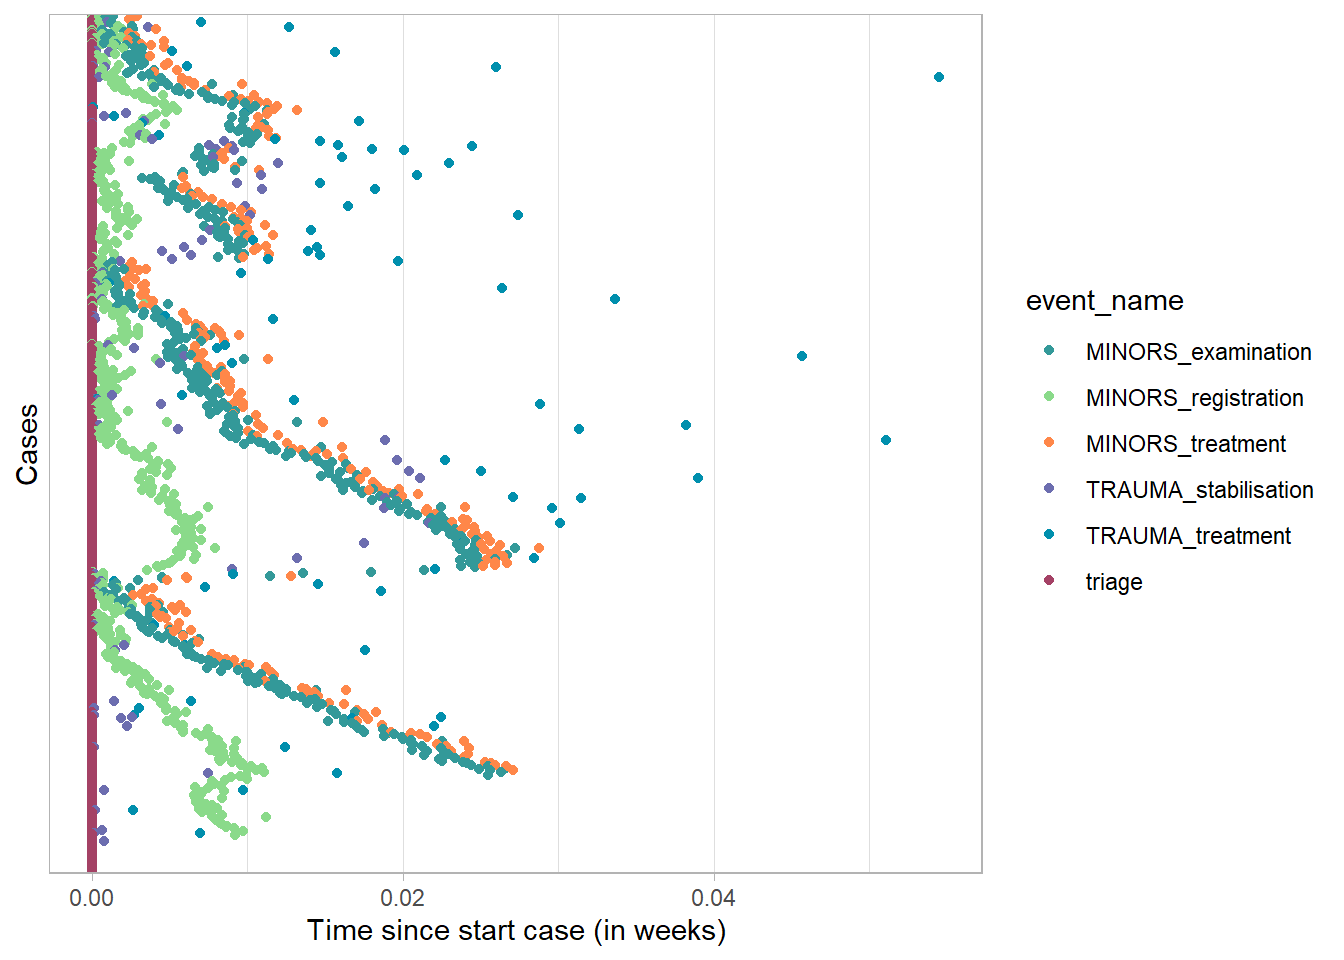
Resource visualisations
Handover-of-work network
activity_log %>%
    resource_map()
Resource precedence matrix
activity_log %>%
    resource_matrix() %>%
    plot()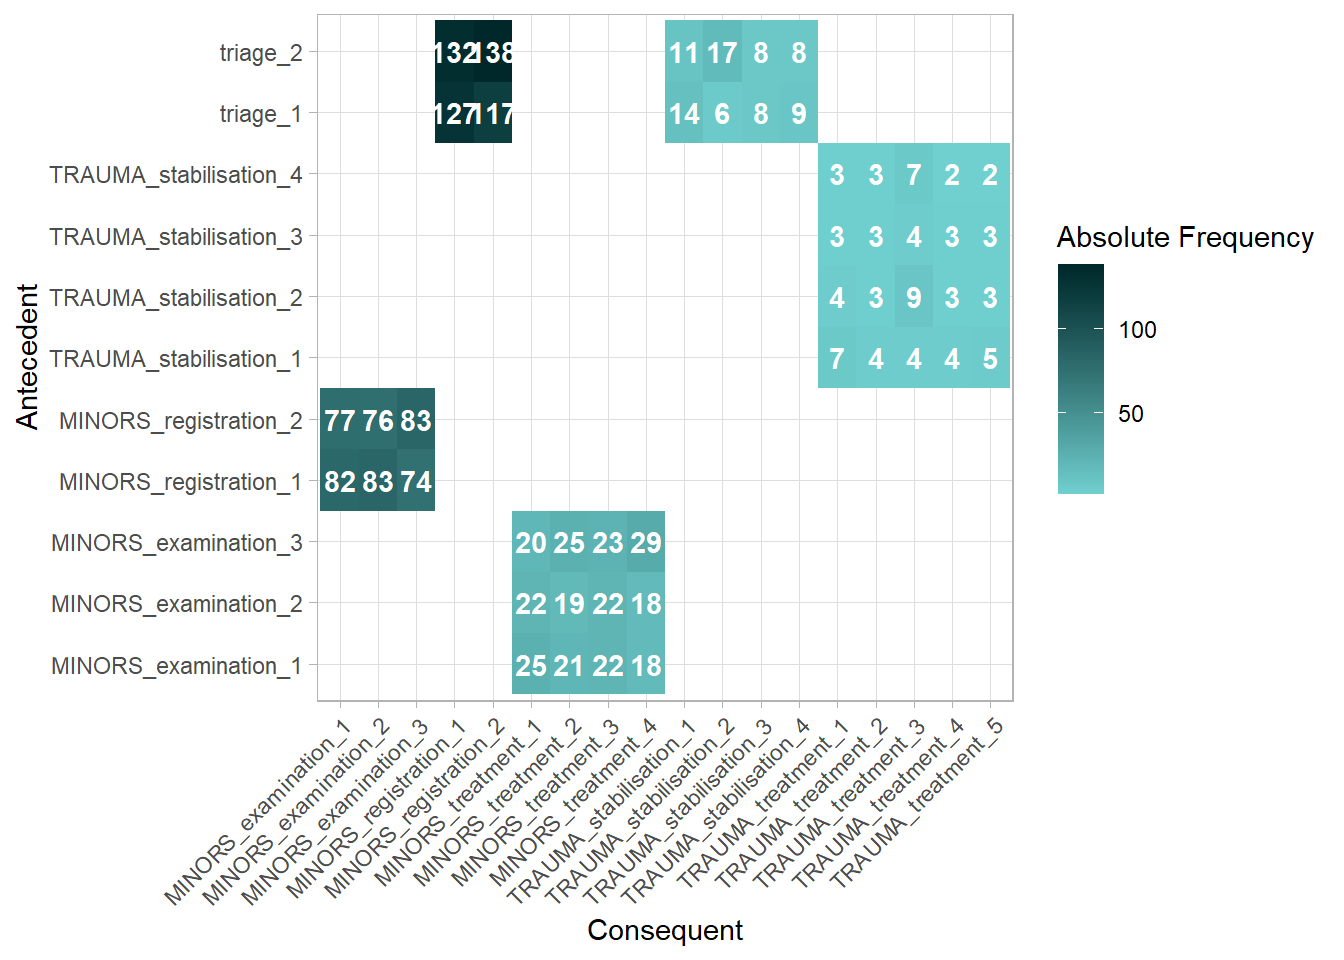
Process matrix
activity_log %>%
    process_matrix(frequency("absolute")) %>%
    plot()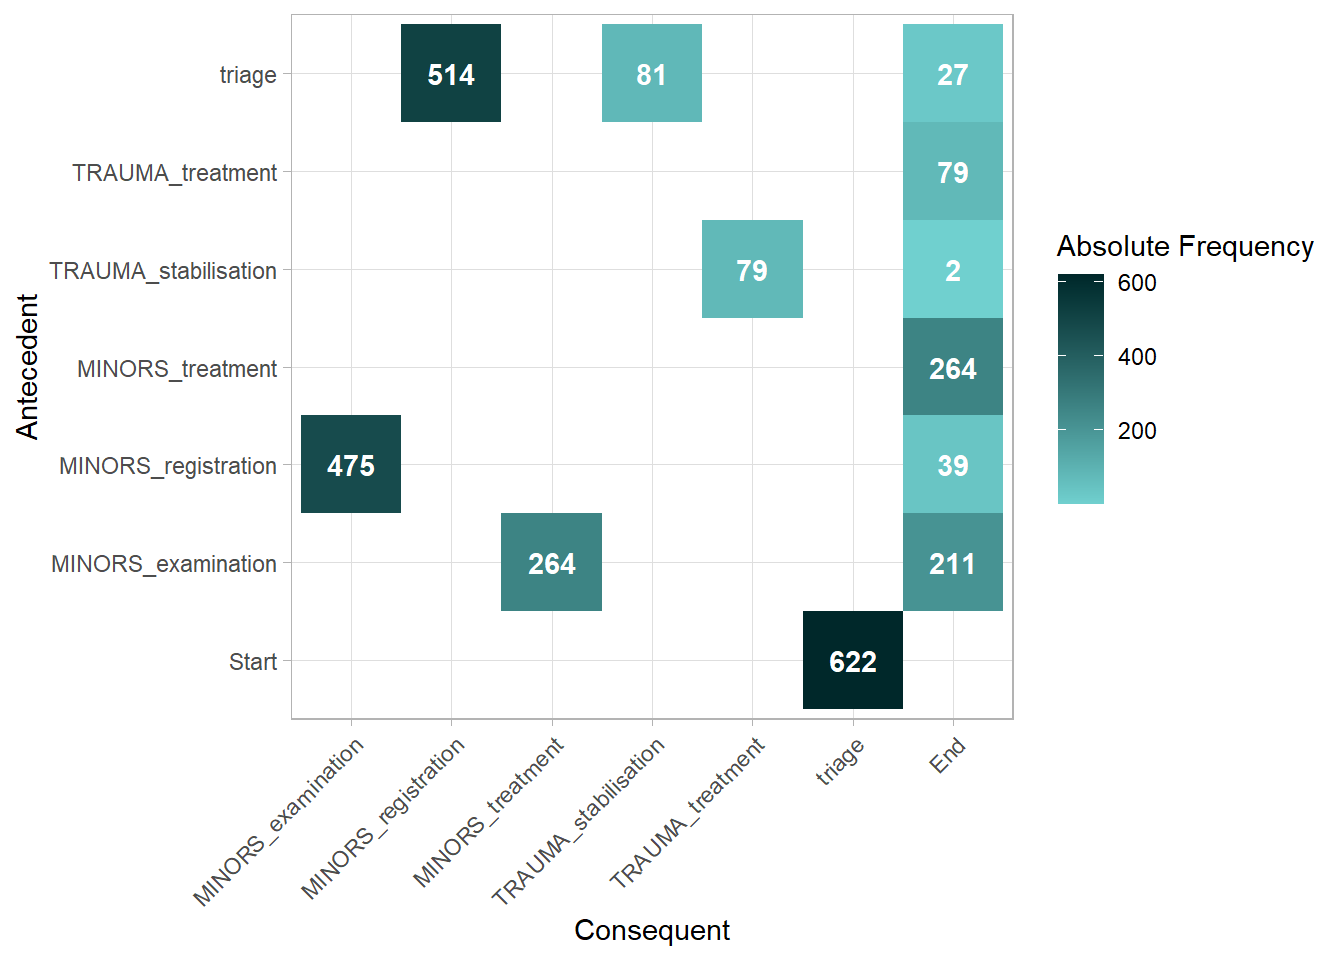
Trace Explorer
This plot helps us to unerstand how often different combinations of activities occur, and whether there are any unexpected paths in our data.
activity_log %>%
    trace_explorer(n_traces = 10)
Warning: Fewer traces (6) found than specified `n_traces` (10).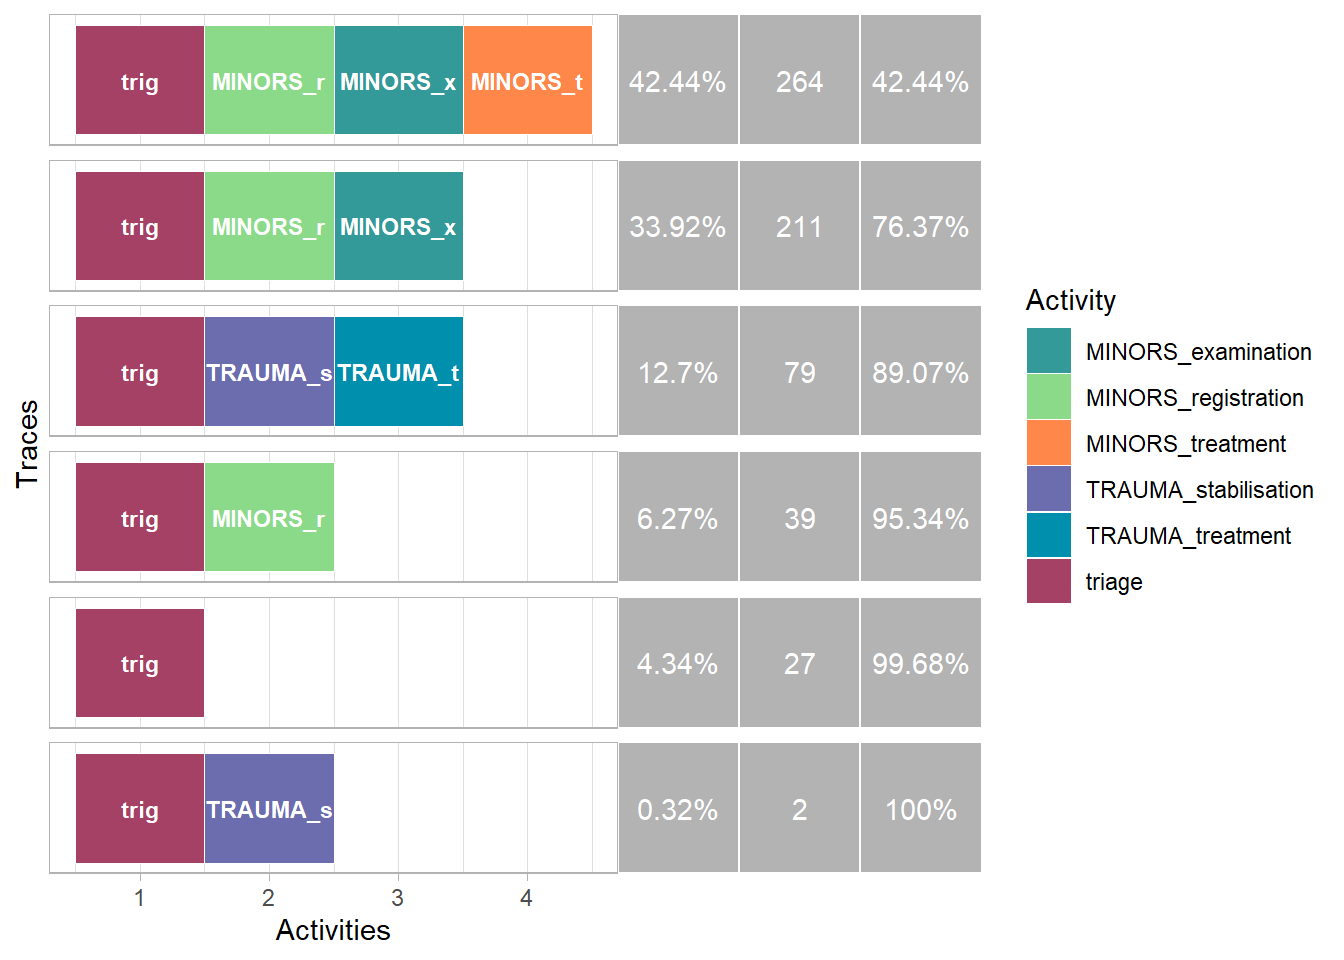
Animated process map
activity_log %>%
    animate_process()
Let’s compare directly with our vidigi output.
Tip
The key difference between what is produced via bupaverse’s animate_process and what can be created via vidigi is the ability of vidigi to more clearly show the scale of queues, and the number of resources available at any given point.
Vidigi can also more clearly highlight the impact of priority on resources through the use of distinct icons, though this is not demonstrated in this example.
Click here to expand vidigi animation generation code
from examples.example_2_branching_multistep.ex_2_model_classes import Trial, g
from vidigi.animation import animate_activity_log
import pandas as pd
import plotly.io as pio
#pio.renderers.default = "notebook"
pio.renderers.default = "iframe"

g.sim_duration = 3000
g.number_of_runs = 3

my_trial = Trial()

my_trial.run_trial()

event_position_df = pd.DataFrame([
    # {'event': 'arrival', 'x':  10, 'y': 250, 'label': "Arrival" },

    # Triage - minor and trauma
    {'event': 'triage_wait_begins',
        'x':  160, 'y': 375, 'label': "Waiting for<br>Triage"  },
    {'event': 'triage_begins',
        'x':  160, 'y': 315, 'resource':'n_triage', 'label': "Being Triaged" },

    # Minors (non-trauma) pathway
    {'event': 'MINORS_registration_wait_begins',
        'x':  300, 'y': 145, 'label': "Waiting for<br>Registration"  },
    {'event': 'MINORS_registration_begins',
        'x':  300, 'y': 85, 'resource':'n_reg', 'label':'Being<br>Registered'  },

    {'event': 'MINORS_examination_wait_begins',
        'x':  465, 'y': 145, 'label': "Waiting for<br>Examination"  },
    {'event': 'MINORS_examination_begins',
        'x':  465, 'y': 85, 'resource':'n_exam', 'label': "Being<br>Examined" },

    {'event': 'MINORS_treatment_wait_begins',
        'x':  630, 'y': 145, 'label': "Waiting for<br>Treatment"  },
    {'event': 'MINORS_treatment_begins',
        'x':  630, 'y': 85, 'resource':'n_cubicles_non_trauma_treat', 'label': "Being<br>Treated" },

    # Trauma pathway
    {'event': 'TRAUMA_stabilisation_wait_begins',
        'x': 300, 'y': 560, 'label': "Waiting for<br>Stabilisation" },
    {'event': 'TRAUMA_stabilisation_begins',
        'x': 300, 'y': 490, 'resource':'n_trauma', 'label': "Being<br>Stabilised" },

    {'event': 'TRAUMA_treatment_wait_begins',
        'x': 630, 'y': 560, 'label': "Waiting for<br>Treatment" },
    {'event': 'TRAUMA_treatment_begins',
        'x': 630, 'y': 490, 'resource':'n_cubicles_trauma_treat', 'label': "Being<br>Treated" },

    {'event': 'depart',
    'x':  670, 'y': 330, 'label': "Exit"}
    ])
animate_activity_log(
event_log=my_trial.all_event_logs[my_trial.all_event_logs['run']==0],
event_position_df=event_position_df,
scenario=g(),
entity_col_name="patient",
debug_mode=False,
setup_mode=False,
every_x_time_units=5,
include_play_button=True,
gap_between_entities=10,
gap_between_resources=20,
gap_between_queue_rows=20,
plotly_height=600,
plotly_width=1000,
override_x_max=700,
override_y_max=675,
entity_icon_size=12,
resource_icon_size=15,
wrap_queues_at=10,
step_snapshot_max=50,
limit_duration=3000,
time_display_units="dhm",
display_stage_labels=False,
add_background_image="https://raw.githubusercontent.com/Bergam0t/vidigi/refs/heads/main/examples/example_2_branching_multistep/Full%20Model%20Background%20Image%20-%20Horizontal%20Layout.drawio.png",
)Other chart types
Dotted chart
We can see the impact of the pattern of daily arrivals across the course of the model, with the waits clearing out overnight when arrivals slow down.
activity_log %>%
    dotted_chart(x = "absolute")
activity_log %>%
    dotted_chart(x = "relative", sort="start")
Breaking down dotted charts by route
Minors
activity_log %>%
    filter(event_name %in% c('MINORS_examination', 'MINORS_registration', 'MINORS_treatment', 'triage')) %>%
    dotted_chart(x = "absolute")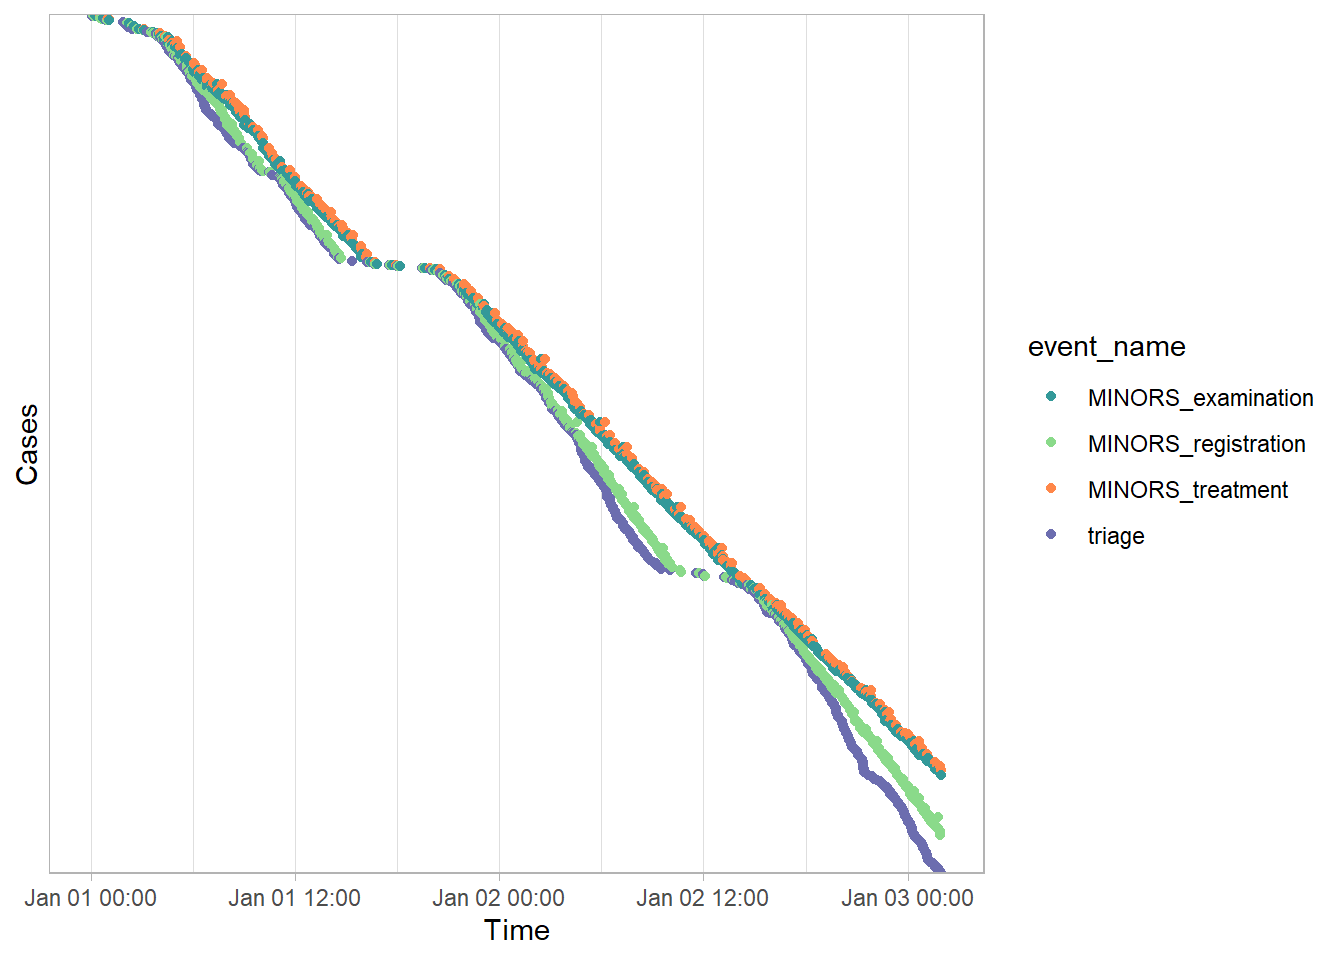
activity_log %>%
    filter(event_name %in% c('MINORS_examination', 'MINORS_registration', 'MINORS_treatment', 'triage')) %>%
    dotted_chart(x = "relative", sort="start")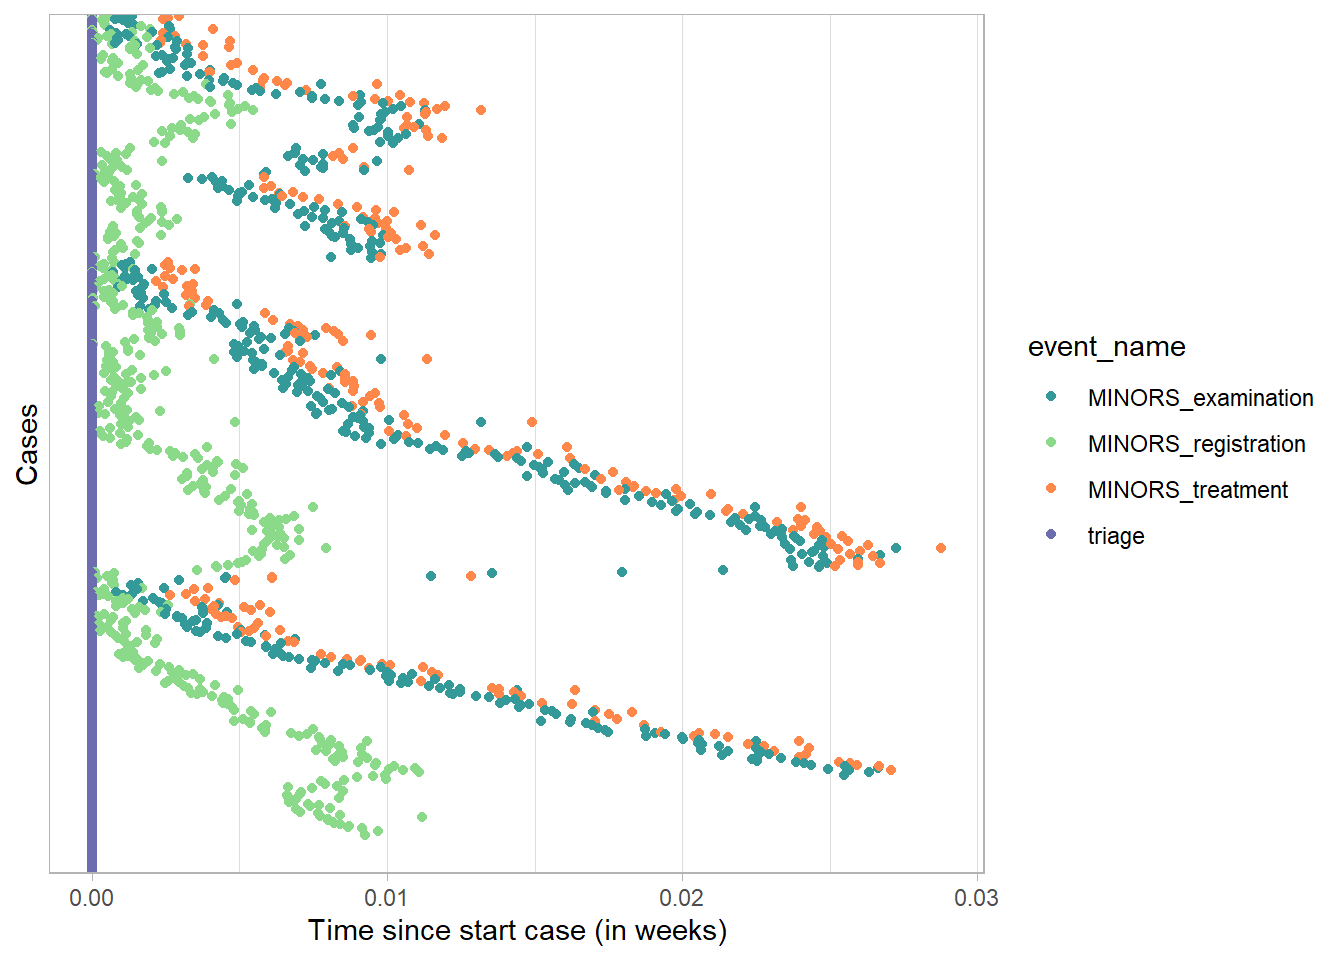
Trauma
activity_log %>%
    filter(event_name %in% c('TRAUMA_stabilisation', 'TRAUMA_treatment', 'triage')) %>%
    dotted_chart(x = "absolute")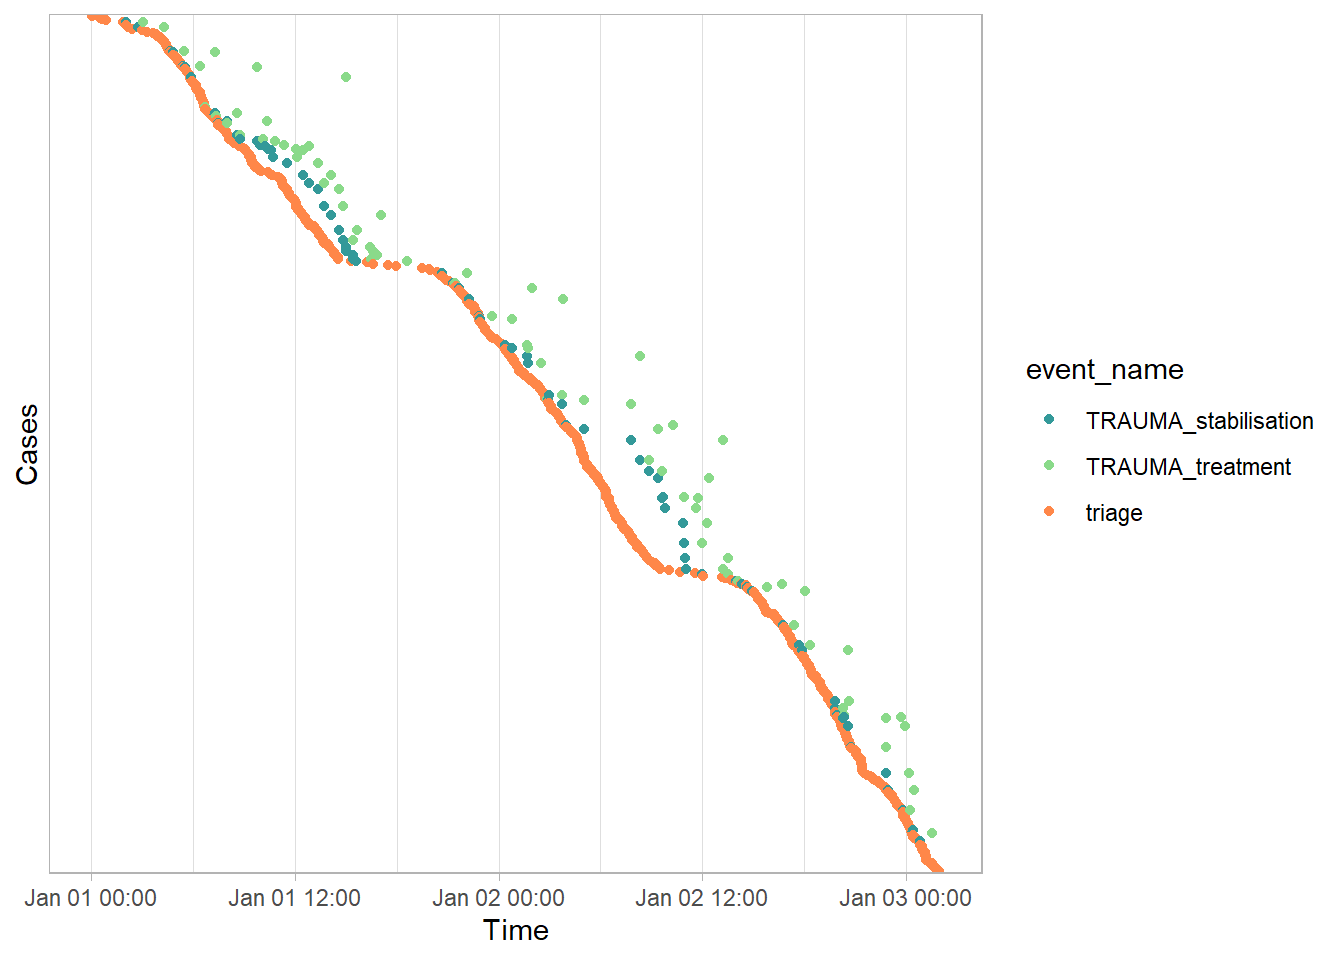
activity_log %>%
    filter(event_name %in% c('TRAUMA_stabilisation', 'TRAUMA_treatment', 'triage')) %>%
    dotted_chart(x = "relative", sort="start")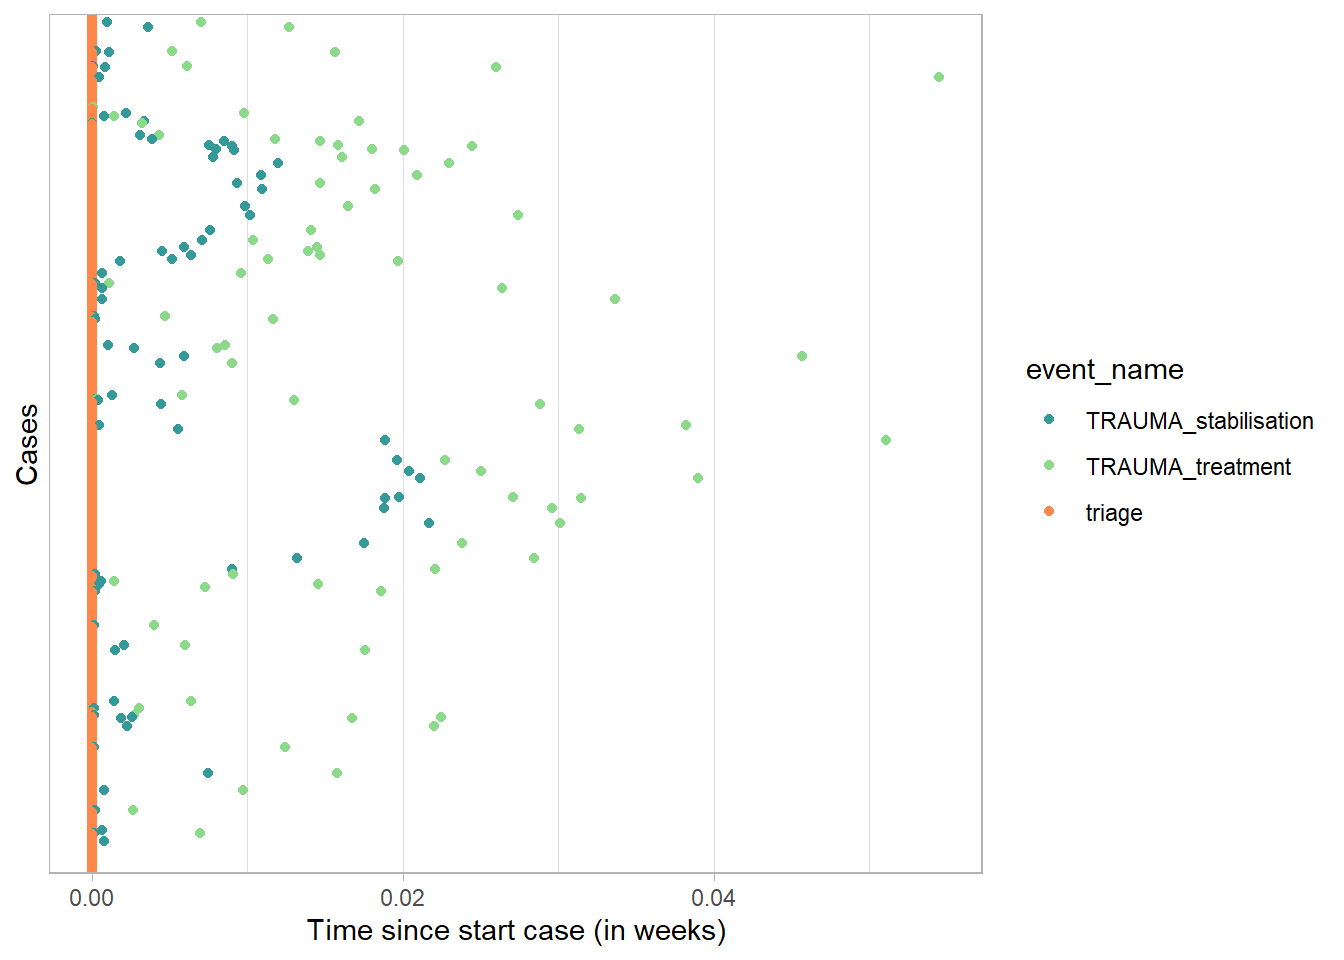
Conclusion
vidigi and bupaR are complementary packages to use when visualising, verifying and validating your simulation models - or working with real-world process data.